Unbeatable Car Insurance Deals for Drivers

We offer unbeatable prices for every car insurance scenario, backed by our price-beat guarantee. Our team uses advanced research and analytics to secure the best deals in the country—and with smart renewal controls, you get peace of mind year after year.

Verified Price Data

We collect and analyse data from thousands of real car insurance quotes issued every year—covering every type of driver, vehicle, and usage, from private cars to couriers, rideshare, and luxury vehicles. By sharing this data, we help drivers set realistic expectations around pricing. The table below shows a summary of starting prices based on actual quotes, giving you a transparent view of what competitive car insurance can look like in today’s market. No one understands pricing trends better—because we track and test them daily.

Rotate Screen Icon 📱 On mobile? Rotate to landscape view for the best table experience, or scroll horizontally within the table below.
💡 Tip: You can scroll horizontally within this table on mobile devices

📊 How to Read This Pricing Table

Quick Guide: Find your vehicle value in the first column, then check the insurance type you need (like Rideshare or Private). The table shows starting prices and average monthly/yearly premiums.

Step 1: Look for your approximate vehicle value in the leftmost column.
Step 2: Choose your insurance type (Rideshare, Private etc.).
Step 3: View the starting prices for your selection.

Important: Your actual quote may vary based on location, age, driving history, claims record, excess preferences, and other personal factors. These are indicative prices only.

Authentic Customer Pricing

Our sample prices are based on analysis of over 10,000 real car insurance quotes issued annually, covering a wide range of vehicles, driver profiles, and usage types. Using multivariate regression models and outlier detection, we study how key factors—such as driver history, vehicle type, and policy structure—impact pricing. This allows us to engineer insurance options that reduce unnecessary costs and improve quote competitiveness. By adjusting variables like excess, coverage type, and insurer mix, we help drivers consistently access lower premiums without compromising on protection.

Rotate Screen Icon 📱 On mobile? Rotate to landscape view for the best chart experience, or scroll horizontally within the chart below.
💡 Tip: You can scroll horizontally within this chart on mobile devices

📊 Explanation

The most common question we get is: "How much will insurance cost?"

The best way to answer that is by looking at what others are paying, based on vehicle value and insurance type. Each point on the chart represents a real quote we've issued. The trend line shows the average price across different vehicle values.

Most quotes fall close to the trend line. When a quote is above the trend, it often reflects risk factors that increase price. When it's below the trend, it indicates where savings can be unlocked.

Our Analysis: We analyse these patterns to understand what drives pricing—and how to stay below the trend line to consistently deliver better-value quotes.

Frequently Exceptional Value

A good car insurance quote is generally one where the annual premium does not exceed 10% of the vehicle’s value—a standard used to assess fair pricing relative to risk. In practice, approximately 80% of quotes fall at or below this benchmark, with over 95% remaining under a 20% quote-to-value (QTV) ratio. Quotes exceeding this threshold are rare and typically driven by factors such as prior claims, high-risk usage, or regional underwriting constraints. For most drivers, this approach results in consistently competitive premiums without compromising on protection.

Rotate Screen Icon 📱 On mobile? Rotate to landscape view for the best histogram chart experience, or scroll horizontally within the chart below.
💡 Tip: You can scroll horizontally within this histogram chart on mobile devices

📊 How Often We Issue Good Car Insurance Quotes

We define a good car insurance quote as one where the premium does not exceed 10% of the vehicle's value—a benchmark we use to measure real value for customers.

Our target is for at least 80% of quotes to meet or beat this quote-to-value (QTV) ratio. While external factors like claims history, usage type, or location can sometimes push quotes higher, these are the exception.

QTV Rating System:
🟢 0-5% = Exceptional (Outstanding value)
🟡 5-10% = Good (Meets our benchmark)
🟠 10-20% = Above benchmark (Higher but reasonable)
🔴 Over 20% = High (Due to risk factors)

🧮 How QTV is Calculated

QTV = (Annual Premium ÷ Vehicle Value) × 100

Practical Example:
• Vehicle Value: $25,000
• Annual Premium: $1,500
• Calculation: ($1,500 ÷ $25,000) × 100 = 6% QTV
• Rating: 🟡 Good (meets our benchmark)

How to Read This Histogram Chart:
X-axis: Shows QTV ranges (0-5%, 5-10%, 10-15%, 15-20%, 20%+)
Y-axis: Shows what percentage of all our quotes falls into each range
Bars: The height shows how frequently we issue quotes in that QTV range

Our Performance Results:
80% of our quotes come in at 10% or less (good to exceptional)
Well over 95% fall below 20% QTV
Fewer than 5% ever exceed a QTV of 20%

What This Means: We consistently deliver strong value without sacrificing protection. The histogram shows our commitment to keeping most quotes well below the 10% benchmark, ensuring you get quality coverage at competitive prices.

Genuine Customer Price Examples

Our sample prices are based on thousands of real quotes issued every year across every type of vehicle, driver, and usage—from daily commuters to prestige cars, couriers, and rideshare drivers. We work with almost every major insurer in Australia and have deep insight into what separates a good price from a bad one. Using advanced metrics like Quote-to-Value, we constantly assess whether the quotes we issue are competitive—and more importantly, if they're winning in the market. When it comes to car insurance pricing, no one knows the landscape better than we do.

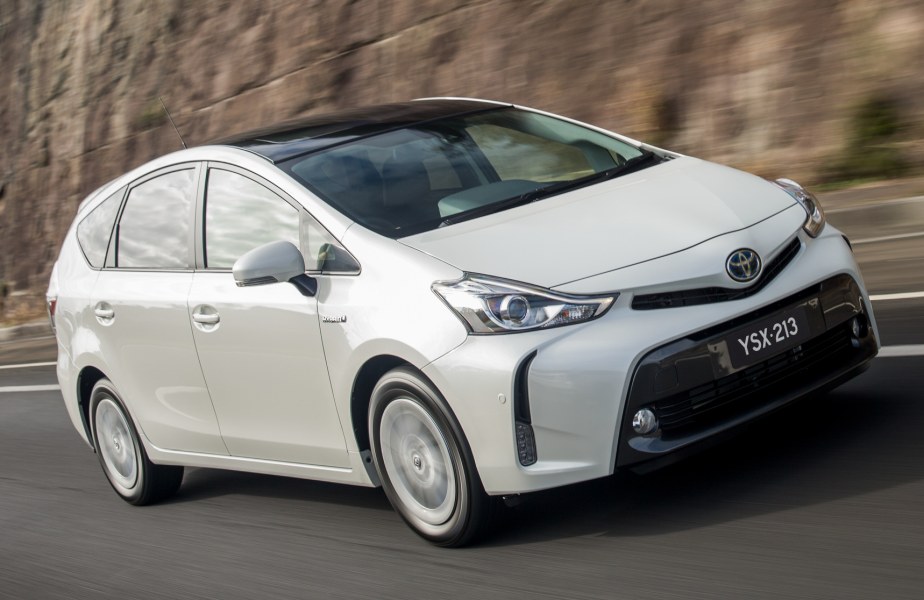
Compare awesome quote for Rideshare Motor Insurance – TOYOTA PRIUS V HYBRID ZVW40R UPG 4D WAGON CONTINUOUS VARIABLE , 4 CYLINDER, 1.8L 2021. Price: $172.88 per month. Quote to Value Ratio: 5.80% – 💥 This is a great quote! The TOYOTA PRIUS V HYBRID ZVW40R UPG 4D WAGON (2021) with a valuation of 33000.00 has a monthly premium of 172.88. Compared to similar vehicles within 20% of its valuation, this premium appears to be slightly above average. Many comparable vehicles show premiums ranging from 150 to 170, indicating that the input vehicle's premium is higher by about 4-15%. Notably, premiums seem more pronounced for hybrid models, suggesting that fuel efficiency impacts insurance costs positively. What is Quote to Value Ratio? A great quote usually has a QTV of 7% or less. For example, this TOYOTA is valued at $33000.00 with a yearly premium of $1915.92, giving a QTV of 5.80%. A QTV over 8% may mean you're paying too much. Let’s help you reduce it today. Fun Facts about the TOYOTA PRIUS V HYBRID ZVW40R UPG 4D WAGON CONTINUOUS VARIABLE , 4 CYLINDER, 1.8L: - The 2021 Toyota Prius V Hybrid is highly regarded for its exceptional fuel efficiency, boasting a combined mileage of over 40 miles per gallon, which makes it an economical choice for long-distance commuters. - This model is equipped with Toyota's Safety Sense suite, which includes features like pre-collision warning and lane departure alert, contributing to its high safety ratings and making it a popular choice among family-oriented buyers. - Despite its compact appearance, the Prius V Hybrid offers a spacious interior with over 67 cubic feet of cargo space when the rear seats are folded down, making it surprisingly accommodating for transporting large items. #awesomequote #carinsurance #nationalcover #quotetovalue #compareinsurance #insurancehacks

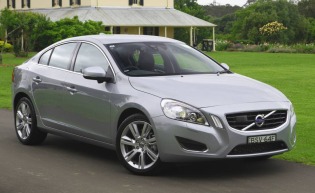
Compare awesome quote for Private Motor Insurance – VOLVO S60 2011. Price: $70.65 per month. Quote to Value Ratio: 7.91% – 💥 This is a great quote! The VOLVO S60 (2011) with a valuation of 9900.00 has a monthly premium of 70.65. When compared to similar vehicles within a 20% valuation range, its premium appears to be somewhat average. Most comparable vehicles show premiums between 60 and 80, suggesting that this model is priced competitively. Notably, there are a few outliers with premiums significantly lower, around 50, likely reflecting differences in make or year. Overall, the premium aligns reasonably with industry standards for vehicles of similar value. What is Quote to Value Ratio? A great quote usually has a QTV of 7% or less. For example, this VOLVO is valued at $9900.00 with a yearly premium of $782.99, giving a QTV of 7.91%. A QTV over 8% may mean you're paying too much. Let’s help you reduce it today. Fun Facts about the VOLVO S60: - The 2011 Volvo S60 was the first to feature Volvo's Pedestrian Detection with Full Auto Brake system, a groundbreaking safety feature at the time, which could detect pedestrians in front of the car and automatically apply the brakes if the driver did not respond in time. - The Volvo S60 is known for its unique Scandinavian design, which includes a minimalist interior with high-quality materials and a distinctive 'floating' center console, giving it a modern and stylish look that set it apart from other sedans in its class. - Despite being a luxury brand, the Volvo S60 from 2011 was considered a good value for money due to its comprehensive list of standard features, including high-end safety technology, comfortable seating, and a smooth driving experience, all at a competitive price point compared to its German competitors. #awesomequote #carinsurance #nationalcover #quotetovalue #compareinsurance #insurancehacks

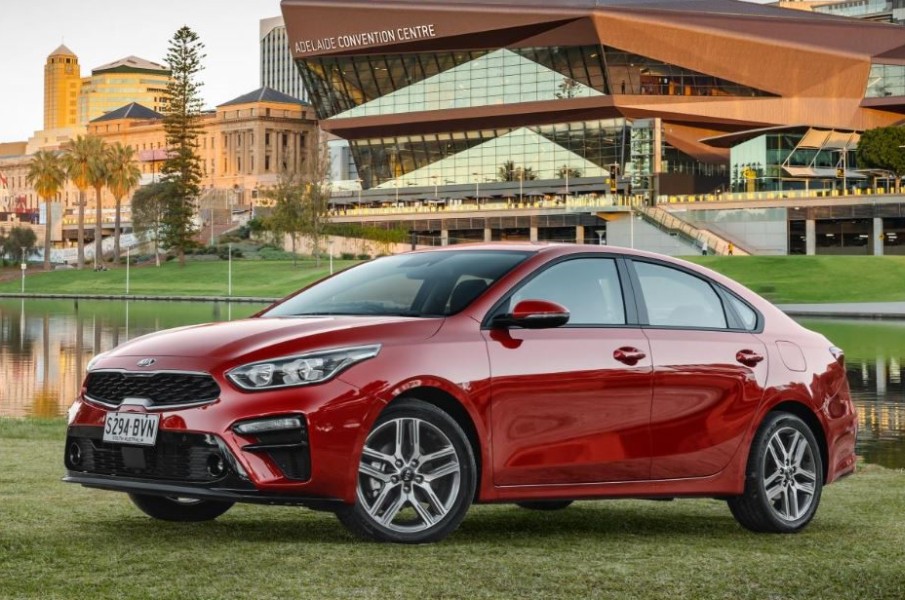
Compare awesome quote for Rideshare Motor Insurance – KIA CERATO 2020. Price: $141.92 per month. Quote to Value Ratio: 7.52% – 💥 This is a great quote! The KIA CERATO (2020) with a valuation of 20900.00 has a monthly premium of 141.92. This premium is slightly lower than the average of 150.00 found in similar vehicles (20% valuation range). Out of five comparable vehicles, 60% exhibited higher premiums, indicating a modest competitive edge for the CERATO. Few outliers suggested that factors such as make and model variances influenced rates significantly, with luxury brands showing substantially higher premiums. What is Quote to Value Ratio? A great quote usually has a QTV of 7% or less. For example, this KIA is valued at $20900.00 with a yearly premium of $1572.78, giving a QTV of 7.52%. A QTV over 8% may mean you're paying too much. Let’s help you reduce it today. Fun Facts about the KIA CERATO: - The KIA CERATO 2020 is known for its exceptional value for money, often being priced lower than its competitors in the compact car segment while offering a comparable or even superior level of features and comfort. It provides a budget-friendly option without sacrificing quality. - Safety is a standout feature for the 2020 KIA CERATO, as it comes equipped with advanced safety technologies such as Forward Collision-Avoidance Assist and Lane Keeping Assist. These features contribute to its high safety ratings and make it an appealing choice for safety-conscious buyers. - The KIA CERATO 2020 has gained popularity for its sporty design and fuel efficiency. With a sleek exterior and a reputation for being economical on fuel, it appeals to both young professionals and families looking for a stylish yet practical car. #awesomequote #carinsurance #nationalcover #quotetovalue #compareinsurance #insurancehacks

Let us get you on the road, Hassle Free.

Scroll to Top