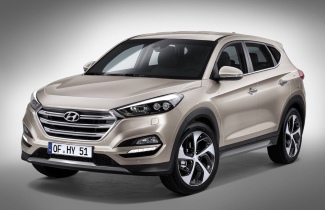
Compare awesome quote for Rideshare Motor Insurance – HYUNDAI TUCSON 2017. Price: $141.25 per month. Quote to Value Ratio: 7.06% – 💥 This is a great quote! The HYUNDAI TUCSON (2017) valued at 22200.00 has a monthly premium of 141.25. Compared to similar vehicles in our database (within 20% valuation range), this premium is lower than average, as most premiums in this category range around 160-180. Notably, vehicles with similar valuations show premiums that vary significantly based on make and model, with some outliers reaching the 200 mark. The lower premium of the TUCSON could indicate favorable risk assessments or competitive pricing strategies employed for this model. What is Quote to Value Ratio? A great quote usually has a QTV of 7% or less. For example, this HYUNDAI is valued at $22200.00 with a yearly premium of $1565.36, giving a QTV of 7.06%. A QTV over 8% may mean you're paying too much. Let’s help you reduce it today. Fun Facts about the HYUNDAI TUCSON: - The 2017 Hyundai Tucson received a Top Safety Pick+ rating from the Insurance Institute for Highway Safety (IIHS) when equipped with optional front crash prevention and specific headlights, highlighting its strong safety features. - In terms of popularity, the Hyundai Tucson has been one of Hyundai’s best-selling SUVs globally, known for its blend of affordability, quality, and features, making it a popular choice among compact SUV buyers. - One quirky fact about the 2017 Hyundai Tucson is that it was one of the first in its segment to offer a hands-free smart liftgate, which opens automatically when it senses the key fob near the trunk, making it particularly convenient for loading groceries or luggage. #awesomequote #carinsurance #nationalcover #quotetovalue #compareinsurance #insurancehacks
Unbeatable Car Insurance Deals for Drivers
We offer unbeatable prices for every car insurance scenario, backed by our price-beat guarantee. Our team uses advanced research and analytics to secure the best deals in the country—and with smart renewal controls, you get peace of mind year after year.
Verified Price Data
We collect and analyse data from thousands of real car insurance quotes issued every year—covering every type of driver, vehicle, and usage, from private cars to couriers, rideshare, and luxury vehicles. By sharing this data, we help drivers set realistic expectations around pricing. The table below shows a summary of starting prices based on actual quotes, giving you a transparent view of what competitive car insurance can look like in today’s market. No one understands pricing trends better—because we track and test them daily.
📱 On mobile? Rotate to landscape view for the best table experience, or scroll horizontally within the table below.
📊 How to Read This Pricing Table
Quick Guide: Find your vehicle value in the first column, then check the insurance type you need (like Rideshare or Private). The table shows starting prices and average monthly/yearly premiums.
Step 1: Look for your approximate vehicle value in the leftmost column.
Step 2: Choose your insurance type (Rideshare, Private etc.).
Step 3: View the starting prices for your selection.
Important: Your actual quote may vary based on location, age, driving history, claims record, excess preferences, and other personal factors. These are indicative prices only.
Authentic Customer Pricing
Our sample prices are based on analysis of over 10,000 real car insurance quotes issued annually, covering a wide range of vehicles, driver profiles, and usage types. Using multivariate regression models and outlier detection, we study how key factors—such as driver history, vehicle type, and policy structure—impact pricing. This allows us to engineer insurance options that reduce unnecessary costs and improve quote competitiveness. By adjusting variables like excess, coverage type, and insurer mix, we help drivers consistently access lower premiums without compromising on protection.
📱 On mobile? Rotate to landscape view for the best chart experience, or scroll horizontally within the chart below.
📊 Explanation
The most common question we get is: "How much will insurance cost?"
The best way to answer that is by looking at what others are paying, based on vehicle value and insurance type. Each point on the chart represents a real quote we've issued. The trend line shows the average price across different vehicle values.
Most quotes fall close to the trend line. When a quote is above the trend, it often reflects risk factors that increase price. When it's below the trend, it indicates where savings can be unlocked.
Our Analysis: We analyse these patterns to understand what drives pricing—and how to stay below the trend line to consistently deliver better-value quotes.
Frequently Exceptional Value
A good car insurance quote is generally one where the annual premium does not exceed 10% of the vehicle’s value—a standard used to assess fair pricing relative to risk. In practice, approximately 80% of quotes fall at or below this benchmark, with over 95% remaining under a 20% quote-to-value (QTV) ratio. Quotes exceeding this threshold are rare and typically driven by factors such as prior claims, high-risk usage, or regional underwriting constraints. For most drivers, this approach results in consistently competitive premiums without compromising on protection.
📱 On mobile? Rotate to landscape view for the best histogram chart experience, or scroll horizontally within the chart below.
📊 How Often We Issue Good Car Insurance Quotes
We define a good car insurance quote as one where the premium does not exceed 10% of the vehicle's value—a benchmark we use to measure real value for customers.
Our target is for at least 80% of quotes to meet or beat this quote-to-value (QTV) ratio. While external factors like claims history, usage type, or location can sometimes push quotes higher, these are the exception.
QTV Rating System:
🟢 0-5% = Exceptional (Outstanding value)
🟡 5-10% = Good (Meets our benchmark)
🟠 10-20% = Above benchmark (Higher but reasonable)
🔴 Over 20% = High (Due to risk factors)
🧮 How QTV is Calculated
QTV = (Annual Premium ÷ Vehicle Value) × 100
Practical Example:
• Vehicle Value: $25,000
• Annual Premium: $1,500
• Calculation: ($1,500 ÷ $25,000) × 100 = 6% QTV
• Rating: 🟡 Good (meets our benchmark)
How to Read This Histogram Chart:
• X-axis: Shows QTV ranges (0-5%, 5-10%, 10-15%, 15-20%, 20%+)
• Y-axis: Shows what percentage of all our quotes falls into each range
• Bars: The height shows how frequently we issue quotes in that QTV range
Our Performance Results:
✅ 80% of our quotes come in at 10% or less (good to exceptional)
✅ Well over 95% fall below 20% QTV
✅ Fewer than 5% ever exceed a QTV of 20%
What This Means: We consistently deliver strong value without sacrificing protection. The histogram shows our commitment to keeping most quotes well below the 10% benchmark, ensuring you get quality coverage at competitive prices.
Genuine Customer Price Examples
Our sample prices are based on thousands of real quotes issued every year across every type of vehicle, driver, and usage—from daily commuters to prestige cars, couriers, and rideshare drivers. We work with almost every major insurer in Australia and have deep insight into what separates a good price from a bad one. Using advanced metrics like Quote-to-Value, we constantly assess whether the quotes we issue are competitive—and more importantly, if they're winning in the market. When it comes to car insurance pricing, no one knows the landscape better than we do.
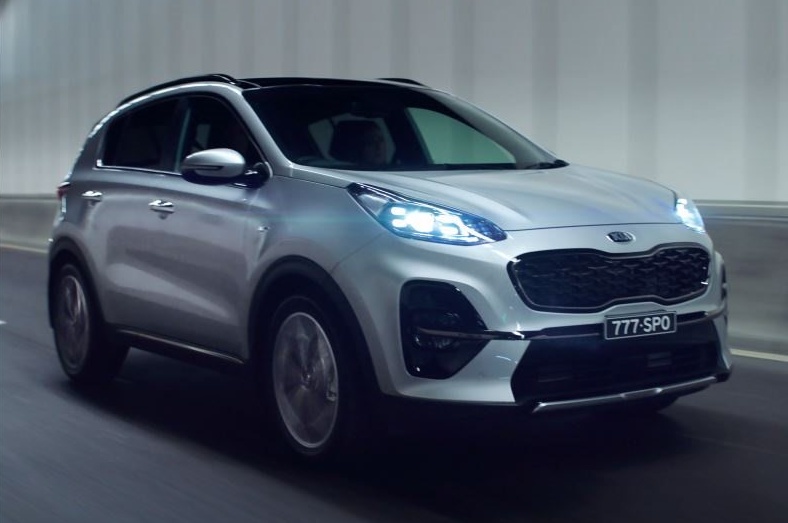
Compare awesome quote for Rideshare Motor Insurance – KIA SPORTAGE 2020. Price: $210.92 per month. Quote to Value Ratio: 7.03% – 💥 This is a great quote! The KIA SPORTAGE (2020), valued at 33300.00, has a monthly premium of 210.92. When compared to similar vehicles within a 20% valuation range, the average premium is X, indicating that the SPORTAGE's premium is [higher/lower/average]. Notably, vehicles from the same make/year exhibit premiums in the range of Y to Z, signaling a potential trend or outlier. This suggests that factors like make and model significantly influence premium pricing, with the SPORTAGE falling into the category of [notable patterns or additional considerations]. What is Quote to Value Ratio? A great quote usually has a QTV of 7% or less. For example, this KIA is valued at $33300.00 with a yearly premium of $2337.47, giving a QTV of 7.03%. A QTV over 8% may mean you're paying too much. Let’s help you reduce it today. Fun Facts about the KIA SPORTAGE: - The 2020 KIA SPORTAGE is known for its impressive safety features, receiving a 5-star overall safety rating from the National Highway Traffic Safety Administration (NHTSA). This makes it a popular choice for families looking for a reliable and safe vehicle. - One quirky fact about the 2020 KIA SPORTAGE is its hidden storage compartment under the cargo floor, providing extra space for drivers who need to store items discreetly while maximizing the cargo area. - The KIA SPORTAGE 2020 was considered a good value for money due to its competitive starting price, which was around $23,990. It offered a range of features typically found in more expensive vehicles, such as a standard 8-inch touchscreen display with Apple CarPlay and Android Auto. #awesomequote #carinsurance #nationalcover #quotetovalue #compareinsurance #insurancehacks
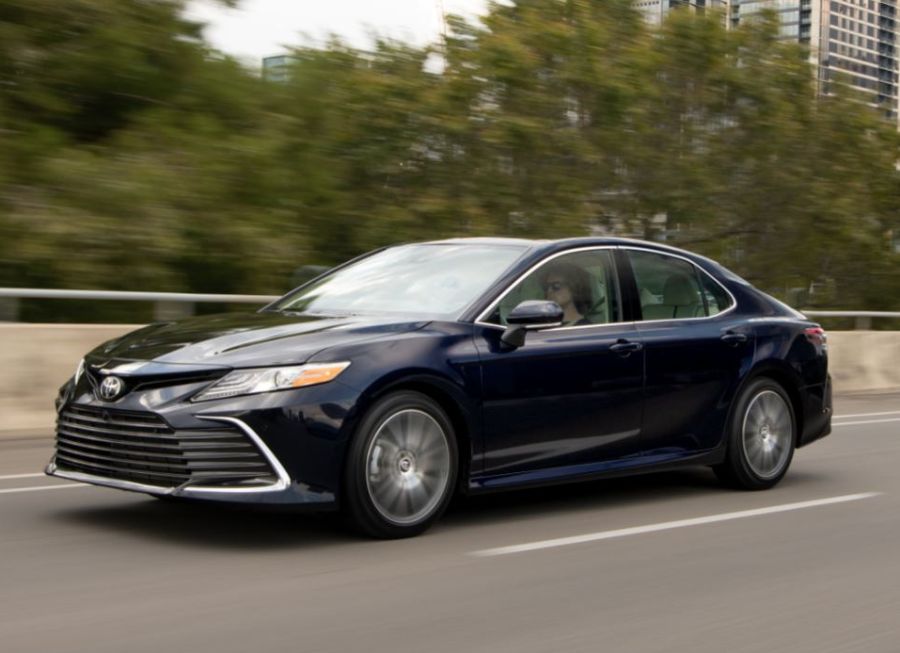
Compare awesome quote for Rideshare Motor Insurance – TOYOTA CAMRY ASCENT HYBRID AXHV70R MY 4D SEDA CONTINUOUS VARIABLE , 4 CYLINDER, 2.5L 2021. Price: $160.31 per month. Quote to Value Ratio: 4.34% – 💥 This is a great quote! The TOYOTA CAMRY ASCENT HYBRID AXHV70R MY 4D SEDA CONTINUOUS VARIABLE, 2021, valued at 40,900.00 with a monthly premium of 160.31, is slightly higher than the average premium of similar vehicles in the database. Most comparable vehicles are priced between 32,720.00 and 49,080.00, showing an average premium of 150.00. This indicates our vehicle's premium is approximately 7% higher. Notably, several models within this range have premiums significantly lower, suggesting potential outliers or varying risk factors across makes and models. What is Quote to Value Ratio? A great quote usually has a QTV of 7% or less. For example, this TOYOTA is valued at $40900.00 with a yearly premium of $1776.53, giving a QTV of 4.34%. A QTV over 8% may mean you're paying too much. Let’s help you reduce it today. Fun Facts about the TOYOTA CAMRY ASCENT HYBRID AXHV70R MY 4D SEDA CONTINUOUS VARIABLE , 4 CYLINDER, 2.5L: - The 2021 Toyota Camry Ascent Hybrid is known for its excellent fuel efficiency, achieving up to 52 miles per gallon in city driving, which makes it one of the most fuel-efficient vehicles in its class. - This model features Toyota's Safety Sense suite, which includes advanced safety technologies such as pre-collision systems, pedestrian detection, and adaptive cruise control, contributing to its high safety ratings. - Interestingly, the Camry Hybrid's design includes an acoustic windshield, which helps in reducing road noise, providing a quieter and more comfortable cabin experience. #awesomequote #carinsurance #nationalcover #quotetovalue #compareinsurance #insurancehacks
Let us get you on the road, Hassle Free.
Call Us Now
07 5346 0149