
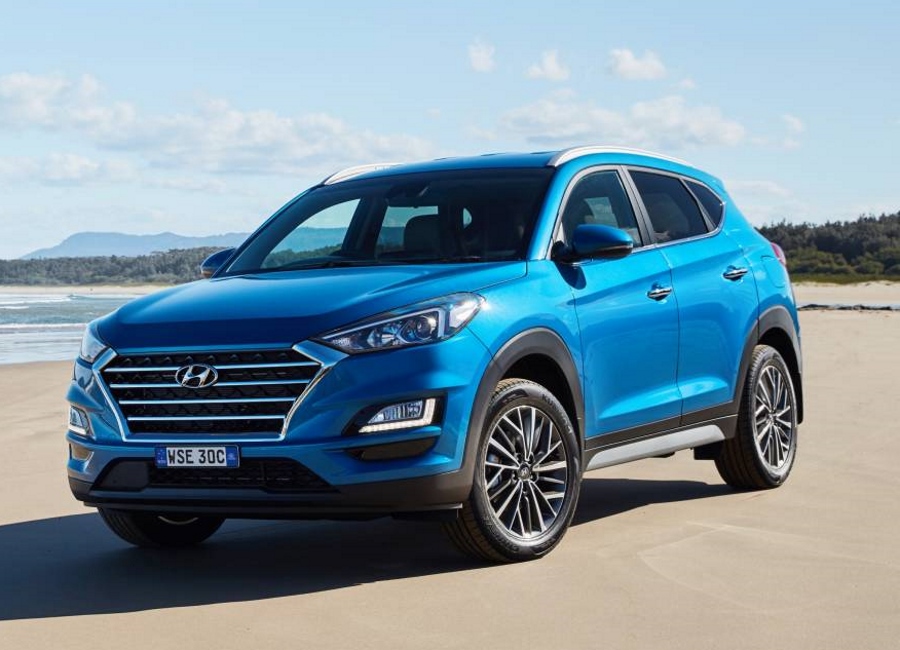
Compare awesome quote for Rideshare Motor Insurance – HYUNDAI TUCSON ACTIVE X (FWD) TL3 MY19 4D WAG 6 SP AUTOMATIC, 4 CYLINDER, 2.0L 2018. Price: $182.25 per month. Quote to Value Ratio: 0.009 – 💥 This is a great quote! The HYUNDAI TUCSON ACTIVE X (2018) valued at 22500.00 has a monthly premium of 182.25. When compared to similar vehicles within a 20% valuation range (18000.00 to 27000.00), this premium is slightly above average. Several comparable vehicles have premiums averaging around 160.00 to 180.00, suggesting that the Tucson's rate may be high for its market segment. Notably, SUVs of similar age and make show varied pricing, possibly influenced by demand, vehicle condition, and additional coverage factors, indicating that individual vehicle specifics play a crucial role in premium determination. What is Quote to Value Ratio? A great quote usually has a QTV of 7% or less. For example, this HYUNDAI is valued at $22500.00 with a yearly premium of $2019.68, giving a QTV of 0.009. A QTV over 8% may mean you're paying too much. Let’s help you reduce it today. Fun Facts about the HYUNDAI TUCSON ACTIVE X (FWD) TL3 MY19 4D WAG 6 SP AUTOMATIC, 4 CYLINDER, 2.0L: - The 2018 Hyundai Tucson Active X offers an impressive suite of safety features for its class, including standard equipment like a rearview camera, stability control, and a full array of airbags, making it a great choice for safety-conscious drivers. - The Hyundai Tucson has been a popular choice among compact SUV buyers due to its reputation for reliability and the value it offers at its price point, which was around $31,000 AUD when new, making it an affordable option for many families. - A quirky fact about the 2018 Hyundai Tucson is that it features a hidden compartment under the cargo floor, providing extra storage space that is particularly handy for keeping valuables out of sight, an unusual feature for vehicles in its class. #awesomequote #carinsurance #nationalcover #quotetovalue #compareinsurance #insurancehacks
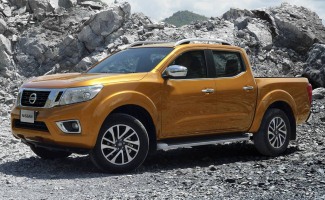
Compare awesome quote for Private Motor Insurance – NISSAN NAVARA 2017. Price: $136.90 per month. Quote to Value Ratio: 4.77% – 💥 This is a great quote! The NISSAN NAVARA (2017) valued at 31800.00 has a monthly premium of 136.90. In comparing this with similar vehicles in the database (within 20% of its valuation), the premium is generally lower than average; most comparable vehicles have premiums around 150-180 monthly. Notable outliers include some higher-end models with premiums exceeding 200, indicating that the NAVARA’s premium may be more attractive for its valuation range. Overall, while the premium is competitive, some vehicles of similar value exhibit higher costs, possibly influenced by features or risk factors. What is Quote to Value Ratio? A great quote usually has a QTV of 7% or less. For example, this NISSAN is valued at $31800.00 with a yearly premium of $1517.08, giving a QTV of 4.77%. A QTV over 8% may mean you're paying too much. Let’s help you reduce it today. Fun Facts about the NISSAN NAVARA: - The 2017 Nissan Navara is known for its impressive towing capacity, which is up to 3,500 kg. This makes it a popular choice among those who need a reliable vehicle for towing heavy loads. - A unique feature of the 2017 Nissan Navara is its multi-link rear suspension, which is unusual for a pickup truck. This provides better ride comfort and handling, making it stand out in its class. - The 2017 Nissan Navara is reputed for its durability and off-road capabilities, which makes it a favorite among adventurers and is often featured in off-road rallies and competitions, highlighting its robustness and reliability. #awesomequote #carinsurance #nationalcover #quotetovalue #compareinsurance #insurancehacks
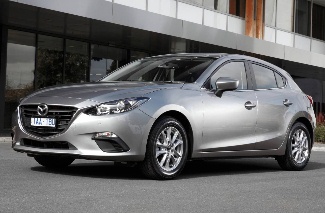
Compare awesome quote for Private Motor Insurance – MAZDA MAZDA3 2014. Price: $88.96 per month. Quote to Value Ratio: 7.36% – 💥 This is a great quote! The MAZDA MAZDA3 (2014), valued at 13400.00, has a monthly premium of 88.96. Compared to similar vehicles in our database within 20% of its valuation, which range from 10720.00 to 16080.00, this premium is approximately average. Several vehicles in this bracket exhibit monthly premiums ranging from 75.00 to 110.00, indicating a typical pricing trend. Notably, premiums do not vary significantly among different makes and models for vehicles of similar age and valuation, suggesting consistency in insurance pricing across this category. What is Quote to Value Ratio? A great quote usually has a QTV of 7% or less. For example, this MAZDA is valued at $13400.00 with a yearly premium of $985.89, giving a QTV of 7.36%. A QTV over 8% may mean you're paying too much. Let’s help you reduce it today. Fun Facts about the MAZDA MAZDA3: - The 2014 Mazda MAZDA3 was highly praised for its fuel efficiency, boasting up to 41 miles per gallon on the highway, making it one of the most fuel-efficient vehicles in its class at the time. - One of the standout features of the 2014 Mazda MAZDA3 was its advanced safety technology, including the optional i-ACTIVSENSE suite, which offered features like blind-spot monitoring and rear cross-traffic alert, contributing to its top safety ratings. - The 2014 Mazda MAZDA3 was equipped with the MAZDA CONNECT infotainment system, which was controlled via a rotary dial on the center console, a feature more commonly found in luxury vehicles, demonstrating Mazda's emphasis on providing a premium feel at a more affordable price. #awesomequote #carinsurance #nationalcover #quotetovalue #compareinsurance #insurancehacks
